Targetmethod
To study, display and provide a technology for finding the true causes of the problem under consideration for their effective resolution, i.e. correlate causes with results (consequences). It is one of the most elegant and widely used instrumental quality control methods.
There are three main types of cause-result diagrams:
Branched™ (detail) process analysis.
Classification of the production process.
Enumeration of reasons.
Method assignment. Used in development and continuous product improvement. The Ishikawa diagram is a tool that provides a systematic approach to identifying the actual causes of problems.
Action plan
In accordance with the well-known Pareto principle, among the many potential causes (causal factors, according to Ishikawa) that generate problems (consequence), only two or three are the most significant, and their search should be organized. For this, the following is carried out:
Collection and systematization of all causes that directly or indirectly affect the problem under study;
grouping these causes according to semantic and cause-and-effect blocks;
ranking them within each block;
Analysis of the resulting picture. Method features
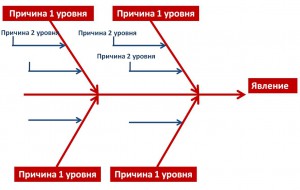
On fig. 4.11 shows the main view of the diagram.
Equipment (Machine)
Materials (Material) . Methods
Personnel
Environment (Milieu)
Sometimes they add a measuring system (Measurement Sys tem)

General construction rules
All participants must agree on the problem statement.
The problem under study is written on the right side in the middle clean slate paper and is enclosed in a frame, to which the main horizontal arrow approaches on the left - the “ridge” (the Ishikawa diagram due to appearance often referred to as the "fish skeleton").
The main causes (level 1 causes) affecting the problem are applied - "big bones". They are framed and connected by slanted arrows to the "ridge".
4 Secondary causes (level 2 causes) are then plotted, which affect the main causes (the "big bones"), which in turn are the effect of secondary causes. Secondary causes are recorded and arranged as "medium bones" adjacent to "large" ones. Level 3 causes that affect Level 2 causes are arranged as “small bones” adjacent to “medium” ones, etc. (If not all causes are shown in the diagram, one arrow is left empty).
In the analysis, all factors, even those that seem insignificant, should be identified and recorded, since the purpose of the scheme is to find the most correct way and effective way to solve the problem.
Reasons (factors) are evaluated and ranked according to their importance, highlighting the most important ones, which presumably have the greatest impact on the quality indicator.
All the necessary information is entered into the diagram: its title; product name; names of participants; date, etc.
Additional Information:
The process of identifying, analyzing and explaining the causes is key in structuring the problem and moving on to corrective actions.
By asking the question “why?” when analyzing each cause, it is possible to determine the root cause of the problem (by analogy with identifying the main function of each element of an object in a cost analysis).
A way to look at logic in the direction of "why?" is to consider this direction as a process of gradual disclosure of the entire chain of successively interconnected causal factors that influence the quality problem.
Advantages of the method The Ishikawa diagram allows you to:
Stimulate creative thinking;
Present the relationship between causes and compare their relative importance. Disadvantages of the method
The logical verification of the chain of causes leading to the root cause is not considered, i.e. there are no rules for checking in the opposite direction from the root cause to the results.
A complex and not always clearly structured diagram does not allow drawing the right conclusions.
Expected Result
Obtaining the information necessary for making management decisions.
The graphical method, which is called the Ishikawa diagram, helps to analyze and form meaningful causal relationships. Such a system analysis tool is somewhat reminiscent of a fish bone in appearance. The diagram certainly has a central horizontally located axis and “ribs” extending from it.
The Japanese professor Ishikawa came up with his diagram in the middle of the last century, when he was intensively looking for ways to identify the causes of problems that arose in scientific and applied research. The scientist wanted to develop a usable system analysis method that would be a visual representation of the problems that exist in the system.
The technique proposed by Ishikawa makes it possible to divide the causes of a particular phenomenon into several groups. For example, machines and mechanisms, production methods, materials, external environment. Any of these groups may contain the causes of unwanted effects. Each of these reasons can, if desired, be decomposed into smaller system elements, deepening the analysis.
Applications of the Ishikawa diagram
Ishikawa's technique almost immediately after publication found wide application in production management, where it began to be used to analyze product quality and solve complex production problems. Today, the Ishikawa diagram is widely used all over the world, including in the theory of invention, where it is used to identify the causes of technical contradictions.
The main scope of the Ishikawa method is a system analysis in order to identify the immediate causes of an existing problem. The diagram can be successfully used for element-by-element analysis of production and marketing processes in an enterprise, their systematization and structuring. Recently, the technique has been increasingly used in brainstorming.
How to build an Ishikawa diagram
First, the researcher clarifies the problem, its essence and complexity. After that, the starting point of the analysis is constructed, which has the form of a horizontal arrow pointing to the right. At the tip of the arrow is a well-defined and clearly articulated problem.
Additional arrows are attached to the center line at some angle, each of which denotes one of the possible causes that caused the problem. If the analysis reveals that the causes are in turn due to deeper factors, each of the arrows can branch out.
Having built a detailed graphical display of cause-and-effect relationships, one can visualize the entire system in the dynamics of causes and effects that affect, for example, the result of production activity or the management of an enterprise. Very often, such a visualization tool helps to identify significant factors that, with a different method of analysis, escape attention.
Axial time- the term underlying the entire culturological worldview of the German philosopher Karl Jaspers. He designated as axial time that period in the history of mankind, when the mythological views of people gave way to rational, philosophical thinking, which became the further basis for the development of modern man.
Jaspers' research suggests that all the teachings that arose during the axial time are distinguished by a high degree of rationalism and the desire of a person to rethink all the foundations of his previous existence, to change customs and traditions. Those civilizations that were not able to rethink their worldview in the light of the axial time era simply ceased to exist (for example, the Assyro-Babylonian civilization). Jaspers believes that the axial time is the period between 800 and 200 BC. The data of recent studies also confirm that the period 800-200 years. BC. was of particular importance in the development of the world system. During this period, there was a sharp jump in the development of world urbanization, the level of literacy of the population increased. During the epoch of axial time, the world system was transformed into a qualitatively new state for itself. In the key centers of world culture during this period of time, religious and ethical teachings, completely different from everything that was before, were developing, which were based on fundamentally different values. These values were deep and universal, which allowed these teachings, albeit in a slightly modified form, to survive to this day (Confucianism, Buddhism, Taoism). time a turning point in a person's perception of himself time when a person first begins to perceive his essence and analyze his own thinking. An attempt at self-knowledge underlies all the cardinal changes of that time. It was in the course of attempts to realize one’s existence, to determine the key moral concepts: good and evil, the meaning of life and death, that a new cultural era was born. Thus, the concept of axial time implies a certain period in the development of world culture, during which development trends fundamentally change and cultural values of mankind, which leads to the beginning of a new era in the development of the world system. Thus, Jaspers believes that modern cultures are ahead of a new round of axial time, the result of which will be a single culture on a planetary scale.
Sources:
- www.terme.ru
Modern technologies for production management and quality management allow for extremely efficient analysis of production processes. One such method, the Ishikawa diagram, has been successfully used in many enterprises around the world.
A state diagram resembles a block diagram and is a process of changing an object as a result of transitions. This concept was introduced several decades ago and has been constantly improved with the development of computing technologies.

Basic concepts
A state diagram is an abstract representation of a process. It is often used in computer science to model the flow of programming languages. It can also help analysts create a business process map. System diagram elements are commonly referred to as objects that can undergo changes in state. The most popular language for writing state diagrams is the Unified Modeling Language or UML. This language allows you to track the process throughout the build. It is usually used to describe the behavior of the system as a whole. The state diagram helps you keep track of objects using various symbols. It usually does not describe the interaction of objects.
Features of creating a state diagram
UML diagrams usually show how an object behaves in various options developments and multiple symbols are often used to identify different elements. A state diagram is very similar to a flowchart. It usually has a large dot at the top, which represents the initial state of the object. Changes in state can be shown as circles, with the name of the object, variables and actions separated from each other. Horizontal lines are usually used to separate each one.
Straight lines in a state diagram can connect elements. Lines usually define transitions. Very often these lines have arrows at one end to show the transition paths from one state to another. At the bottom of the diagram is a large black dot in a circle. The whole scheme can describe a complex chain of events and the conditions under which they occur. There may be more than one such condition.
The process depicted in a state diagram is usually defined by the changes that take place. Some object states may be unlikely. Sometimes multiple transitions lead to the initial state, which can lead to confusion. In this case, one diagram can be enclosed in another. This is then called a superstate. This format makes the state diagram easy to read if the events and transitions in the system are complex.
Conclusion
A state diagram can represent the results of machine operations or the operation of many mechanisms in production system. It can also help the teacher think through their learning programs based on the material that is in stock. Semantics
or rules are often applied to statecharts. There are alternative rules and even variants of models that can be used depending on the problem. For example, manufacturing process for electronic device like stopwatch or controller.
Related videos
In the process of work or training, one often comes across certain graphic schemes, for example, diagrams. This is a commonly used scheme used to display shares, percentages of something. And knowledge about building such diagrams will be quite useful.

Instruction
Use Microsoft Excel to build a chart. Of course, Microsoft Excel has a feature for creating automatic charts. But this is unlikely to suit a person who wants his scheme to be unique and exactly the way he intended it. With a little effort, you can create your own chart in Excel using all the same features.
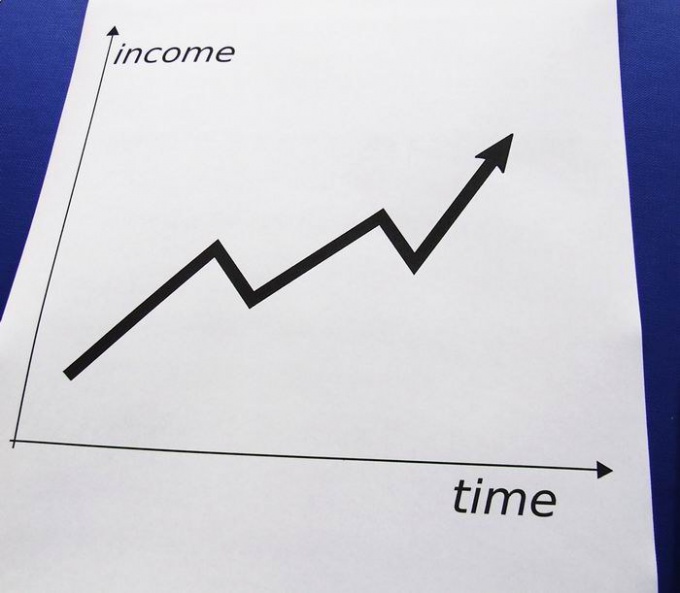
Create a new diagram and get rid of everything unnecessary in it. It should be easy to understand. You should only use two colors. For example, make the background gray and dark blue columns that display indicators. These two colors are the most pleasing to the eye and do not create contrast between themselves. The information will be legible and understandable. You will also need to note the increasing growth of parameters.
Other names of the method: "Cause and effect diagram" ("fishbone")
Method author: K. Ishikawa (Japan), 1952
Purpose of the method
It is used in the development and continuous improvement of products. The Ishikawa diagram is a tool that provides a systematic approach to identifying the actual causes of problems.
Purpose of the method
To study, display and provide a technology for finding the true causes of the problem under consideration for their effective resolution.
The essence of the method
The cause-and-effect diagram is the key to solving problems that arise.
The diagram allows you to systematize all the potential causes of the problems under consideration in a simple and accessible form, highlight the most significant ones and conduct a level-by-level search for the root cause.
Action plan
In accordance with the well-known Pareto principle, among the many potential causes (causal factors, according to Ishikawa) that generate problems (consequence), only two or three are the most significant, and their search should be organized. For this, the following is carried out:
- collection and systematization of all causes that directly or indirectly affect the problem under study;
- grouping these causes according to semantic and cause-and-effect blocks;
- ranking them within each block;
- analysis of the resulting picture.
Method features
Cause and effect diagram ("fishbone")
General construction rules
- Before proceeding with the construction of the diagram, all participants must come to a consensus on the formulation of the problem.
- The problem under study is written on the right side in the middle of a blank sheet of paper and is enclosed in a frame, to which the main horizontal arrow, the "ridge" approaches on the left (the Ishikawa diagram is often called the "fish skeleton" because of its appearance).
- The main causes (level 1 causes) affecting the problem are applied - "big bones". They are framed and connected by slanted arrows to the "ridge".
- Secondary causes (Level 2 causes) are then applied, which influence the main causes (the "big bones"), which in turn are the result of secondary causes. Secondary causes are recorded and arranged as "medium bones" adjacent to "large" ones. Level 3 causes that affect Level 2 causes are arranged as "small bones" adjacent to "medium" ones, etc. (If not all causes are shown in the diagram, one arrow is left empty).
- In the analysis, all factors, even those that seem insignificant, should be identified and recorded, since the purpose of the scheme is to find the most correct path and effective method problem solving.
- Reasons (factors) are evaluated and ranked according to their importance, highlighting the most important ones, which presumably have the greatest impact on the quality indicator.
- All the necessary information is entered into the diagram: its title; product name; names of participants; date, etc.
Additional Information:
- The process of identifying, analyzing and explaining the causes is key in structuring the problem and moving on to corrective actions.
- By asking the question "why?" when analyzing each cause, it is possible to determine the root cause of the problem (by analogy with identifying the main function of each element of an object in a cost analysis).
- A way to look at logic in the direction of "why?" is to consider this direction as a process of gradual disclosure of the entire chain of successively interconnected causal factors that influence the quality problem.
Advantages of the method
The Ishikawa diagram allows you to:
- stimulate creative thinking;
- present the relationship between causes and compare their relative importance.
Disadvantages of the method
- The logical verification of the chain of causes leading to the root cause is not considered, i.e. there are no rules for checking in the opposite direction from the root cause to the results.
- A complex and not always clearly structured diagram does not allow drawing the right conclusions.
Expected Result
Obtaining the information necessary for making management decisions.
One of the effective methods visualization of thinking is a causal diagram Ishikawa Kaoru- a well-known Japanese scientist in the field of quality management, whose name is associated with the revival and development of the Japanese economy.
Another name for the Ishikawa method fishbone("fish skeleton").
Ishikawa proposed a brainstorming tool that provides a systematic approach to identifying the actual causes of problems.
The diagram allows you to systematize everything in a simple and accessible form. possible problems, highlight the most significant and conduct a level-by-level search for the root cause.
There are several stages of brainstorming and diagramming:
- collection and systematization of all causes that directly or indirectly affect the problem under study;
- grouping these causes according to semantic and cause-and-effect blocks;
- ranking them within each block;
- analysis of the resulting picture.
Before starting to build a diagram, all participants in the brainstorming session should clearly articulate the problem.
The problem under study is written on the right side in the middle of a blank sheet of paper and is enclosed in a frame, to which the main horizontal arrow approaches on the left - "ridge"(The Ishikawa diagram is called the “fish skeleton” because of its appearance).
The main reasons are applied ( level 1 reasons) affecting the problem are “big bones”. They are framed and connected by slanted arrows to the "ridge".
Secondary causes are recorded and arranged as "medium bones" adjacent to "large" ones.
Level 3 Causes, which affect the causes of level 2, are arranged in the form of "small bones" adjacent to the "medium", etc.
Reasons (factors) evaluated and are ranked by their importance, highlighting the most important ones, which presumably have the greatest impact on the quality score.
The main thing in solving a problem is to find cause and effect relationships, answer the questions "WHY?"
It is generally accepted that the Ishikawa diagram allows:
- stimulate creative thinking;
- present the relationship between causes and compare their relative importance;
- streamline the work of the creative (training) group.
Using multimedia option It is very important to make such a diagram interactive. Precisely for animated chart Ishikawa, in my opinion, is very effective known. However, in the popular application PowerPoint you can prepare an animated Ishikawa diagram.
Working with a diagram looks spectacular on interactive whiteboard, as well as with messages from brainstorming participants.
Vladimir Malafeev
Certified business coach. He knows how to make the very complex understandable for everyone. Connects theory and practice to solve business issues.
Any person from time to time faces obstacles and problems on his way. Quite often, in response to a challenge, people quickly begin to do something, while not fully understanding the reasons for the current situation. They are trying to get rid of the symptoms, not to find the cause of the disease and fix it.
Someone will say in response: "If you are dying, there is no time to think about the reasons - you need to save yourself." Yes, that's true, but how often do we find ourselves in critical circumstances for our business? Not so often. This means that there is still time for reasoning and assessing the situation.
For example, the head of a small department of 10 people. Quietly peaceful, so the manager does not particularly try to find out what the reason for the dismissal is, and immediately hires a new employee to replace the old one.
After some time, another employee quits. Now the manager begins to look for reasons, and it turns out that because of the third employee who is still working in the department, the emotional climate in the team has deteriorated sharply.
As a result, the manager fires the petty tyrant and the situation is evened out, but by this time he had to lose two employees, in addition, he spent the time and money of the company to find a replacement for them.
Add here the adaptation of a new employee, which will take from 2 weeks to 2 months: during this period, his effectiveness will be low. It is also worth considering the irritation of “senior” colleagues who will have to teach new employees, thereby being distracted from their immediate activities.
As a result, a hasty decision without analyzing the situation reduced the effectiveness of the department for several months. If this happened during the low season for our business, then this is not so critical. What if it's high? In this case, we ourselves have created a situation where there is no time to think about the reasons.
There is a fairly large list of tools for assessing the causes, but today we will talk about a diagram developed by the Japanese chemist Kaoru Ishikawa. The method was created in 1952, that is, this tool has been used for a long time and is considered one of the most proven. In the basic version, it is intended for group work, but nothing prevents you from using it individually - I do just that.
The Ishikawa diagram (also called the "fishbone") is a graph that shows all the factors that could affect the occurrence of a problem.

If you understand, then anyone can apply this diagram to identify the causes of problem situations.
Step one. Describe the problem clearly
For example, a drop in sales in a store. A square is drawn (“head of a fish”), where we enter the problem.
Step two. Determine the main factors
Determine the main factors (“bones of the ridge”) that influenced the development of the problem: people, methods and techniques (sales stages), the external environment (competitors are strangling dumping), goods (we sell consumer goods), and so on. Usually there are no more than six such factors.
Step three. Describe the main factors in more detail
For each "bone of the ridge" we specify what exactly the disadvantage is. For example, employees lack the skills to establish contact during the sale (it is advisable to describe which specific skills).
Step four. "Analyze It"
Assess the influence of each factor of the second level as a percentage or on a 10-point scale. Add up the resulting numbers within one main factor. "Bone" with the most great result and is the main reason for the situation in which we find ourselves. She needs to be dealt with first.
Time to start developing mitigation measures according to your priorities.
If you stick to this simple method, in adverse situations it will become much easier: you will clearly understand what is the cause of the circumstances and what needs to be corrected.